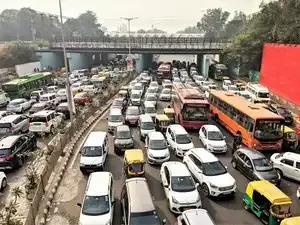
Bengaluru has become the world’s second most congested city in 2025, trailing only Mexico City, according to the latest TomTom Traffic Index, an annual report analyzing global traffic trends and commuting patterns.
The data hits home for traffic-weary Bengaluru residents, especially as the state government continues to promote the city on international platforms as the “city of the future.”
Bengaluru ranked sixth in 2023 and third in 2024, showing a steady rise in congestion over the years. The report notes that the city’s average speed during rush hour in 2025 was just 13.9 km/h, one km/h slower than in 2024.
Which other Indian cities featured in list?
Trailing Bengaluru in congestion was Dublin, Ireland. Other Indian cities in the top-20 list included Pune at 5th place and Mumbai at 18th. Pune’s average speed was 18 km/h, while Mumbai fared slightly better at 20.8 km/h.
The report highlights May 17, 2025—a Saturday—as the worst day on Bengaluru roads, when congestion peaked at 101%, and motorists took 15 minutes to cover just 2.5 km during the evening rush. Heavy rain, fallen trees, and damaged infrastructure were cited as key reasons for the gridlock that day.
Senior police officials blame the city’s poor performance on a rapidly growing vehicle population, limited road expansion, a stagnant road network, and stalled or delayed infrastructure projects.
The data hits home for traffic-weary Bengaluru residents, especially as the state government continues to promote the city on international platforms as the “city of the future.”
Bengaluru ranked sixth in 2023 and third in 2024, showing a steady rise in congestion over the years. The report notes that the city’s average speed during rush hour in 2025 was just 13.9 km/h, one km/h slower than in 2024.
Which other Indian cities featured in list?
Trailing Bengaluru in congestion was Dublin, Ireland. Other Indian cities in the top-20 list included Pune at 5th place and Mumbai at 18th. Pune’s average speed was 18 km/h, while Mumbai fared slightly better at 20.8 km/h.The report highlights May 17, 2025—a Saturday—as the worst day on Bengaluru roads, when congestion peaked at 101%, and motorists took 15 minutes to cover just 2.5 km during the evening rush. Heavy rain, fallen trees, and damaged infrastructure were cited as key reasons for the gridlock that day.
Senior police officials blame the city’s poor performance on a rapidly growing vehicle population, limited road expansion, a stagnant road network, and stalled or delayed infrastructure projects.
World's top 10 slowest cities:
| Rank | City, Country | Congestion Level (%) | Avg Speed (km/h) | Avg Trip Distance (km) | Time Lost (hours/year) |
| 1 | Mexico City, MX | 75.9 | 17.4 | 4.4 | 184 |
| 2 | Bengaluru, IN | 74.4 | 16.6 | 4.2 | 168 |
| 3 | Dublin, IE | 72.9 | 17.4 | 4.4 | 191 |
| 4 | Lodz, PL | 72.8 | 22.5 | 5.6 | 135 |
| 5 | Pune, IN | 71.1 | 18.0 | 4.5 | 152 |
| 6 | Lublin, PL | 70.4 | 27.0 | 6.8 | 117 |
| 7 | Bogota, CO | 69.6 | 18.9 | 4.7 | 153 |
| 8 | Arequipa, PE | 69.5 | 18.0 | 4.5 | 154 |
| 9 | Lima, PE | 69.3 | 17.2 | 4.3 | 195 |
| 10 | Bangkok, TH | 67.9 | 26.1 | 6.5 | 115 |