Allen, Seifert’s early disruption vs Markram, Miller’s sustained domination: NZ’s power meets SA’s balance
Sanjeev Kumar | March 4, 2026 9:22 AM CST

New Zealand's relationship with ICC knockouts is built on poise. South Africa's 2026 campaign, on the other hand, has been built on proof.
As the two sides collide in the T20 World Cup semi-final, this is not just a stylistic clash. It is a confrontation between the tournament's most balanced bowling unit and a New Zealand side that has thrived on explosive batting pockets rather than sustained dominance.
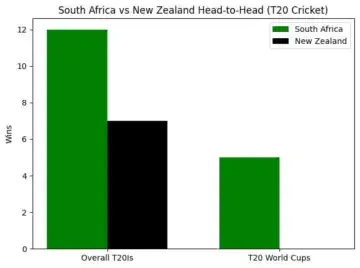
Head-to-head: South Africa vs New Zealand
The overall T20I ledger reads South Africa 12, New Zealand 7 from 19 matches. That gap widens sharply on the World Cup stage.
At the Men's T20 World Cup, New Zealand are yet to beat South Africa. The Proteas led 4-0 historically and extended that to 5-0 earlier in this 2026 edition in Ahmedabad, a group-stage result that reinforced a recurring theme: when these two meet in global tournaments, South Africa have found ways to dominate the clash.
 It isn't just about wins. It's about control. In most of those meetings, South Africa have dictated the tempo - especially through the middle overs, forcing New Zealand to chase phases rather than shape them.
Batting comparison of New Zealand and South Africa: burst scoring vs layered structure
New Zealand's batting: dependent on impact surges
New Zealand's tournament numbers tell a clear story.
It isn't just about wins. It's about control. In most of those meetings, South Africa have dictated the tempo - especially through the middle overs, forcing New Zealand to chase phases rather than shape them.
Batting comparison of New Zealand and South Africa: burst scoring vs layered structure
New Zealand's batting: dependent on impact surges
New Zealand's tournament numbers tell a clear story.
- Tim Seifert: 216 runs, Avg 43.20, SR 157.66
- Glenn Phillips: 176 runs, Avg 44.00, SR 160.00
- Finn Allen: 189 runs, SR 173.39
South Africa's batting: controlled aggression with end-game insurance
South Africa's batting order has been both productive and stable.
- Aiden Markram: 268 runs, Avg 53.60, SR 175.16
- Ryan Rickelton: 228 runs, SR 171.42
- David Miller: 168 runs, Avg 84.00
- Tristan Stubbs: Avg 106.00
- Rachin Ravindra: 9 wickets, Avg 9.77, Econ 6.76
- Matt Henry: 7 wickets, Econ 7.41
- Lockie Ferguson: 5 wickets, Econ 8.75
- Lungi Ngidi: 12 wickets, Avg 13.75, Econ 6.87
- Corbin Bosch: 11 wickets, Avg 14.18, Econ 6.78
- Marco Jansen: 11 wickets, SR 10.8
South Africa's edge is stark: they possess multiple strike options without sacrificing control. Lungi Ngidi and Bosch combine wicket frequency with sub-7 economy. Jansen, even in a higher-growth economy, delivers high-risk, high-reward breakthroughs.
Where New Zealand rely on Ravindra for efficiency, South Africa spread their threat. That diversity makes them less phase-dependent.
Key face-offs for South Africa vs New Zealand
Finn Allen vs Lungi Ngidi
Allen's strike rate of 173.39 is central to NZ's fast starts. Ngidi's strike rate of one wicket every 12 balls suggests early breakthroughs are not accidental. Whoever wins this duel dictates the tempo.
Markram vs Ravindra
Aiden Markram's strike rate of 175.16 has broken games open. Ravindra's 9 wickets at 9.77 average represent NZ's best counter. This phase could decide momentum.
Miller & Stubbs vs Ferguson
With averages of 84 and 106, respectively, South Africa's finishers have rarely been exposed. Lockie Ferguson's role is simple but high-stakes: deny clean straight hitting and force square boundaries.
The analytical verdict
New Zealand enter with knockout composure and explosive upside. But South Africa enter with superior structural balance. The Proteas have more bowlers averaging under 20, more batters finishing unbeaten, and a historical advantage in this specific matchup. If the game becomes volatile early, New Zealand's high-impact hitters can seize it. If it settles into phases, South Africa's layered control gives them the edge.
On pure data weight, South Africa hold the marginal statistical advantage. On knockout temperament, New Zealand remain dangerous. This semi-final, statistically speaking, is power versus probability.
READ NEXT
-
Google’s latest AI image generation model Nano Banana 2

-
Fire broke out in dry bushes near Devi Ahilya Bai Airport, Indore, brought under control in one and a half hour.

-
Want to win the hearts of guests on Holi? Try the famous Singhal recipe of Uttarakhand:

-
Caught in the crossfire: Singaporeans in the Middle East struggle to get home

-
Khaqan Shahnawaz apologizes after mocking Ali Abdullah’s speech